Web Design
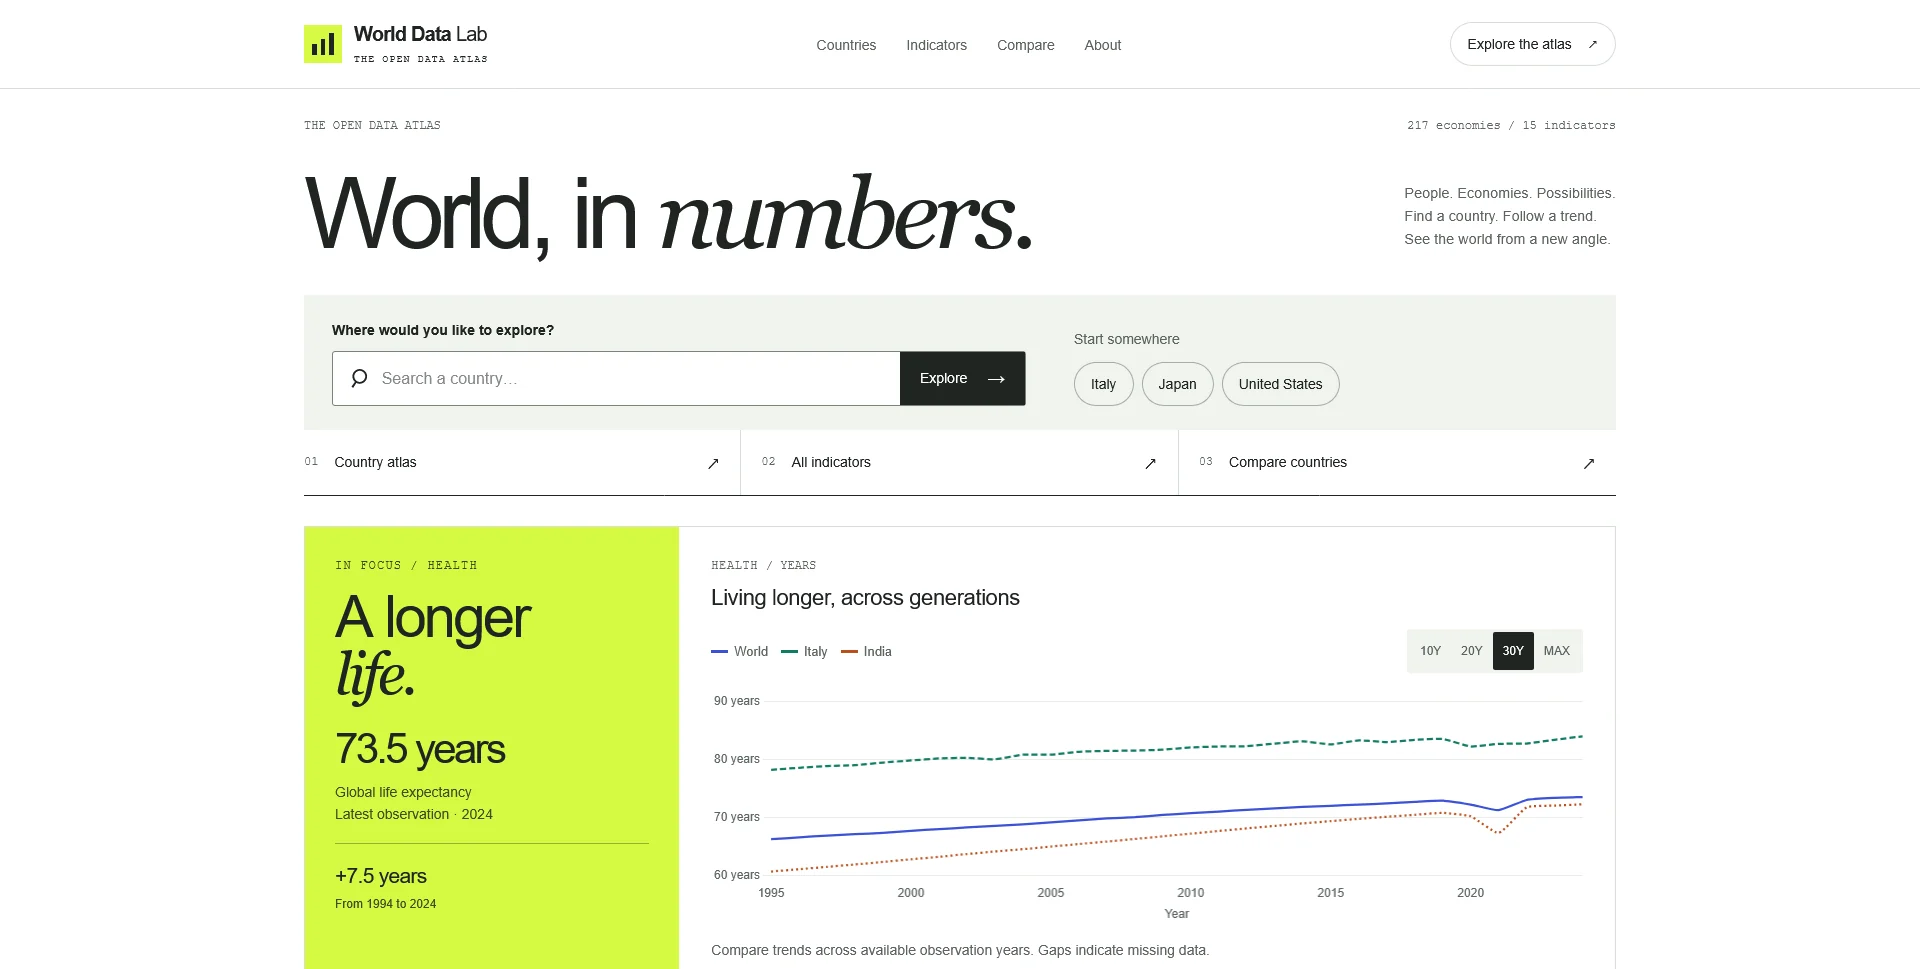
World Data Lab
An open-data atlas connecting country profiles, global indicators and historical comparisons through a clear, editorial interface.
 Let’s talk
Web Design
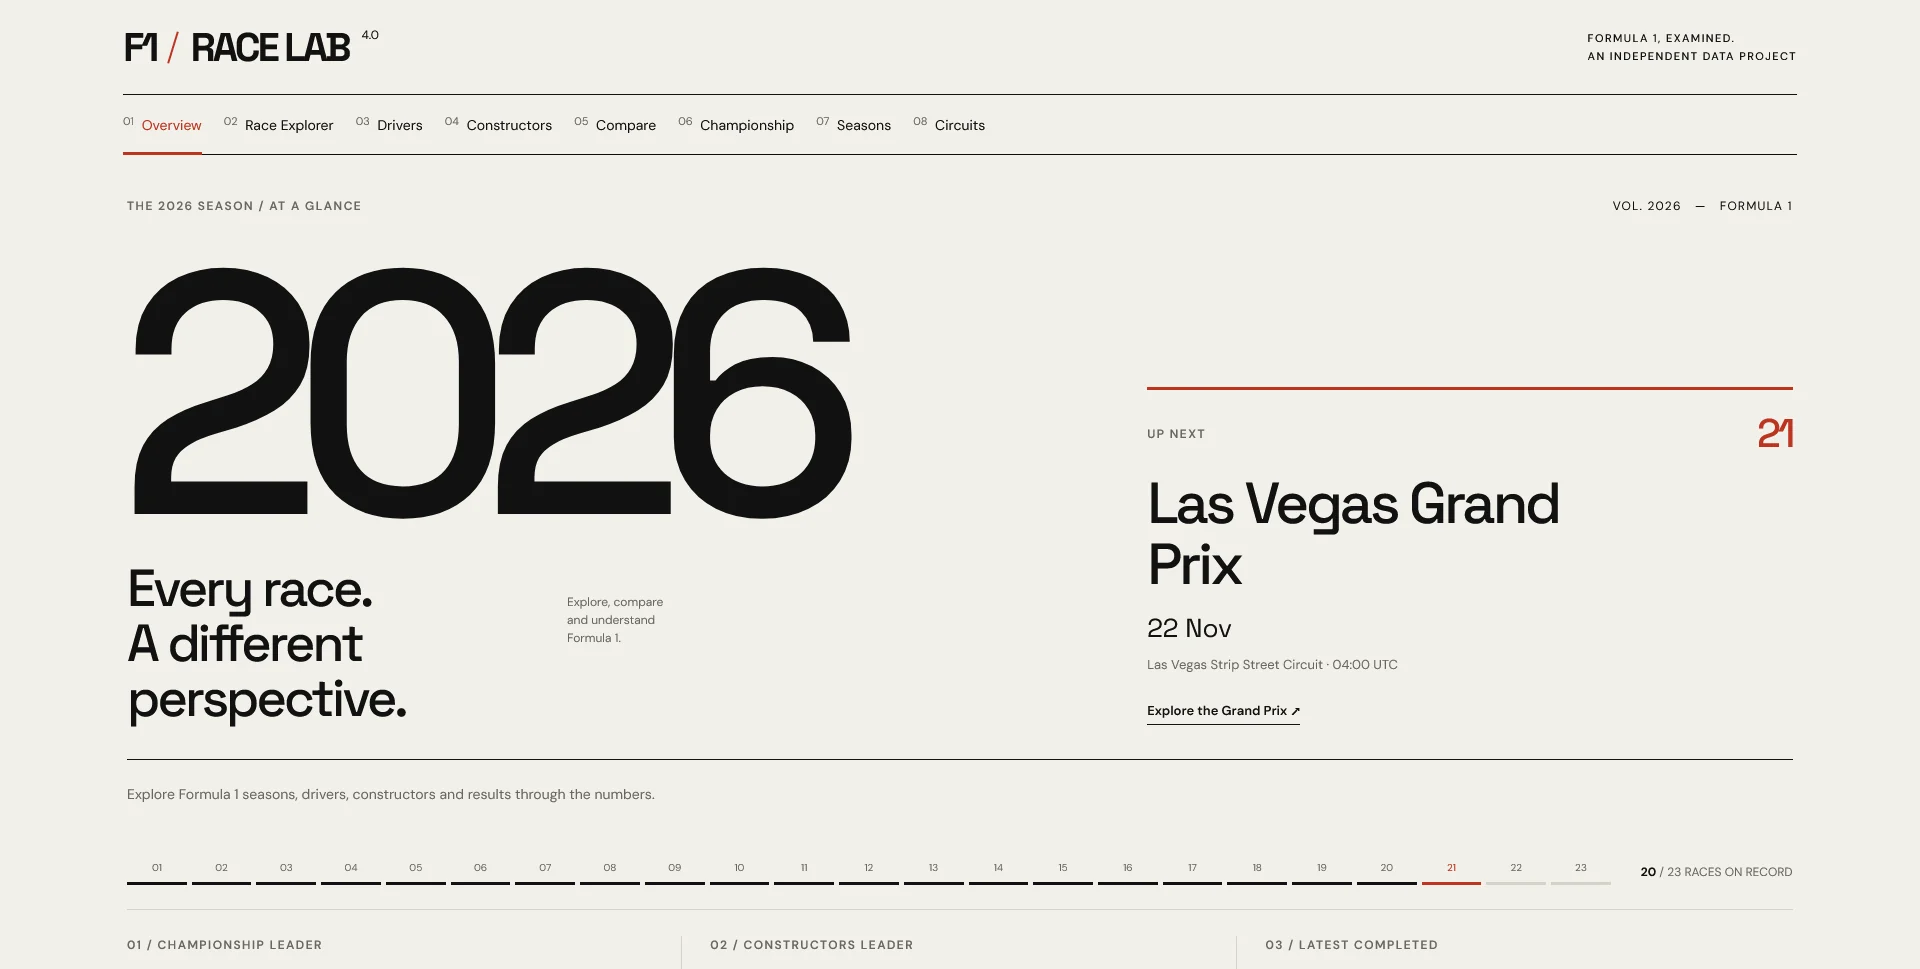
A self-initiated Formula 1 data explorer, bringing seasons, drivers and race results into a clear editorial interface.
F1 Race Lab is a self-initiated data exploration project built around Formula 1 seasons, drivers, constructors and race results. The interface connects an overview of the current season with deeper routes into historical data.
The project presents publicly available information from Jolpica in an editorial layout, with a clear distinction between navigation, race context and numerical results. It is not affiliated with Formula 1, the FIA or Formula One Management.
Visitors can move from a season to its races, drivers and constructors, or explore the archive through dedicated sections. The navigation also includes comparison and championship views.
The design uses large type for the season and a restrained hierarchy for schedules, standings and links. Data is the content of the experience, so legibility and navigable relationships take priority over decorative effects.
This project brings together interface design, responsive front-end implementation and a public data API. Race results update as Jolpica makes information available; the interface depends on that source’s coverage and availability.
The image above is a capture of the live application on 20 September 2026. It documents the interface at that moment and is not a live standings widget.
For another approach to navigating a large body of information, explore Tonight Movie Finder. These projects inform my Web Design.
World Data Lab explores the same challenge of making public data approachable, with country profiles and global indicators.
The data visualization design guide explores the wider interface questions behind sports and public-data products: understandable comparisons, visible units, missing observations and access to values beyond hover.
Web Design
An open-data atlas connecting country profiles, global indicators and historical comparisons through a clear, editorial interface.
Web Design
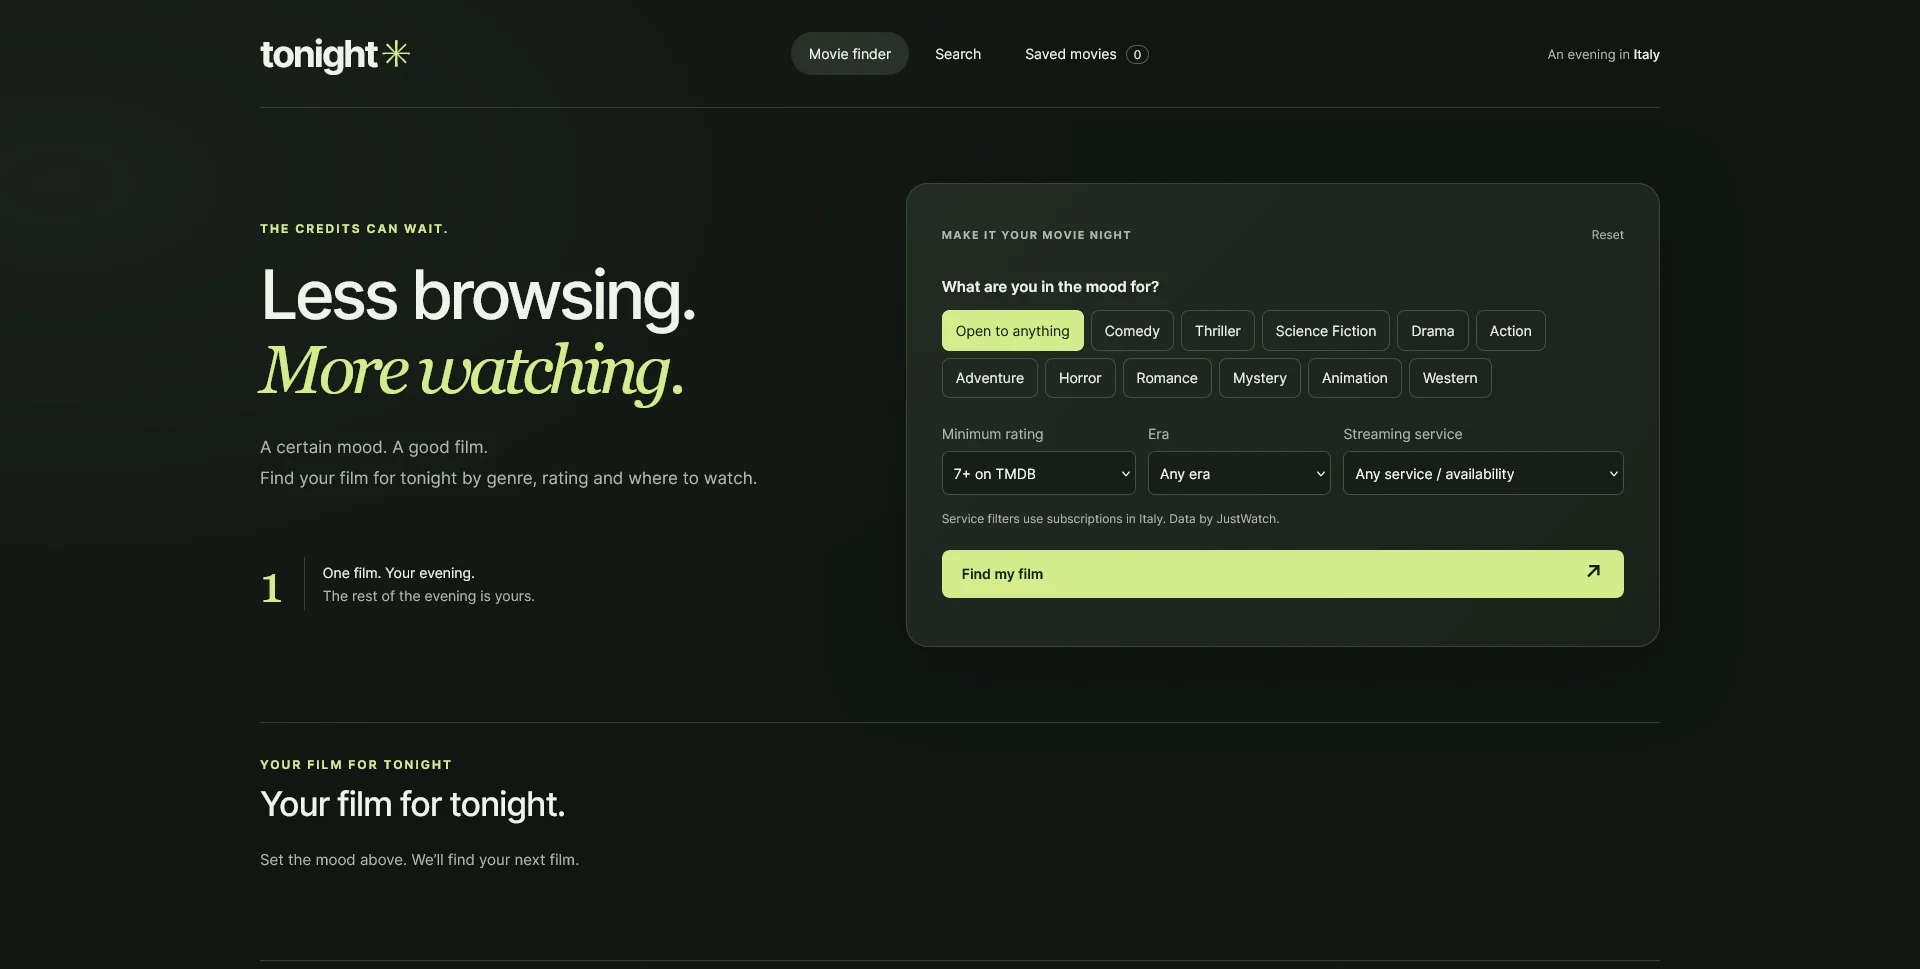
A focused movie discovery tool: choose a mood, get one suggestion, explore the people behind it and save films for another evening.
Web Design
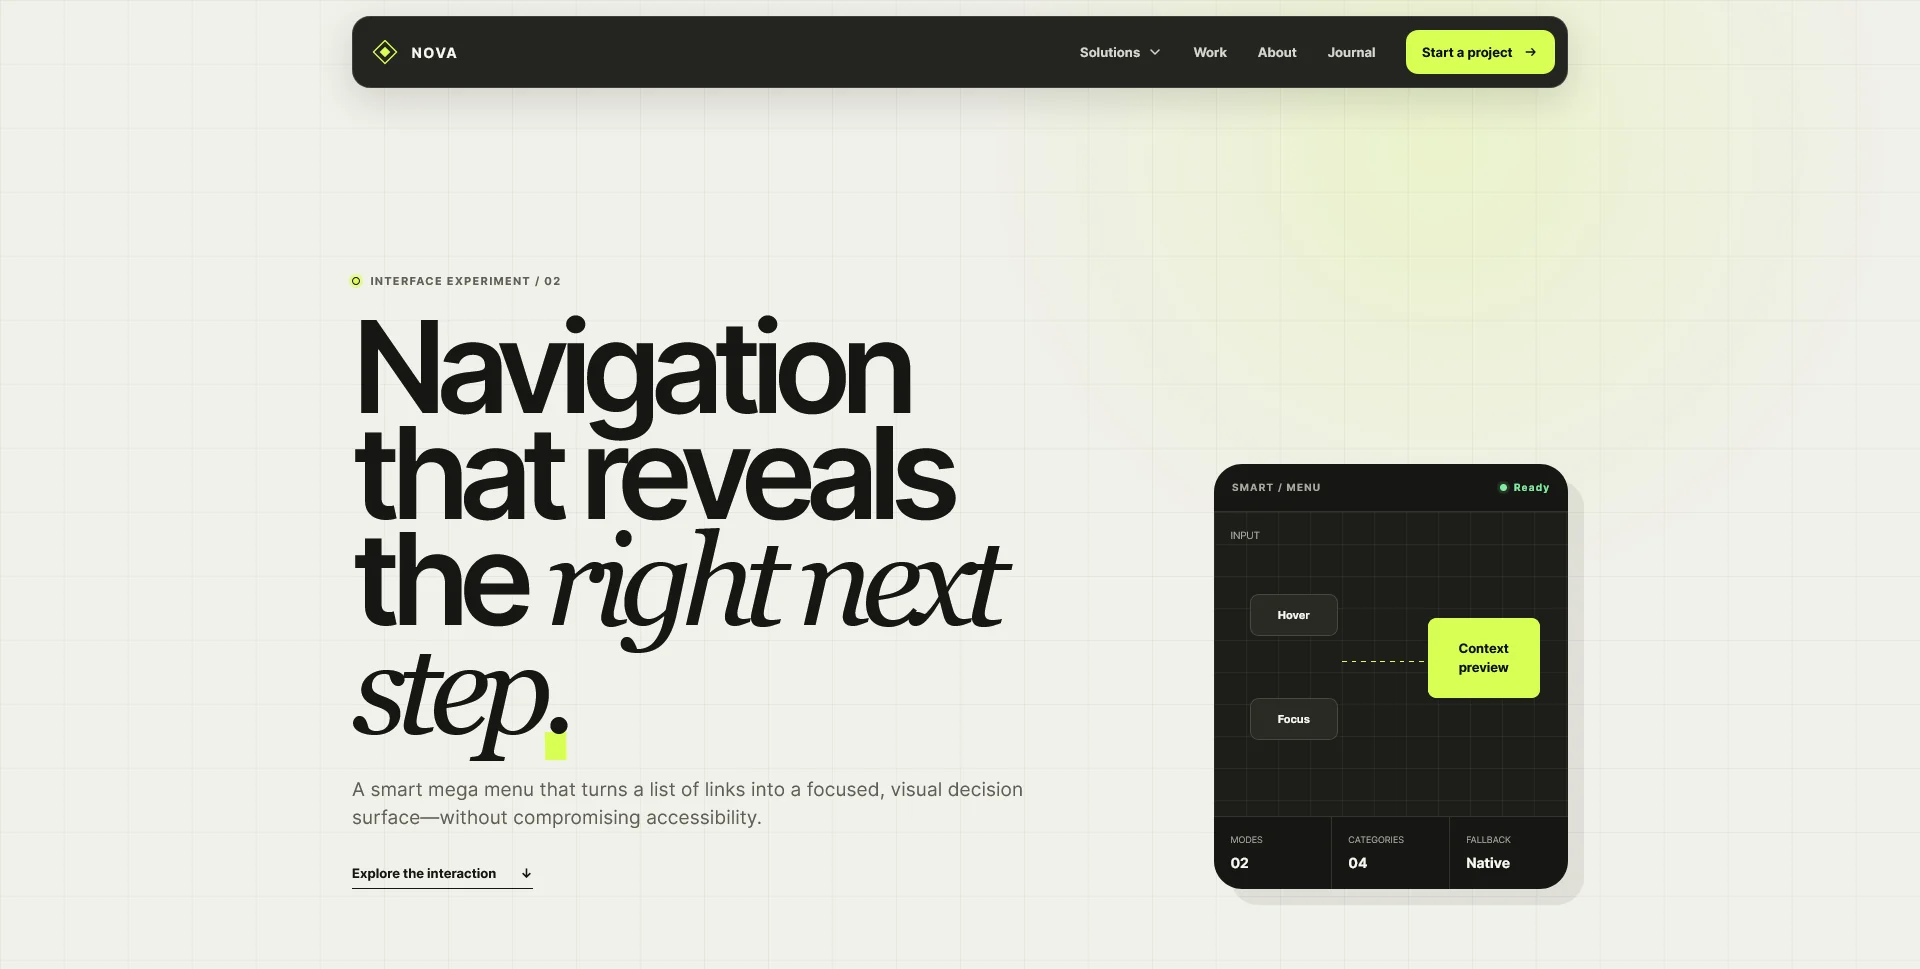
A responsive mega menu concept with contextual previews, keyboard navigation and a mobile disclosure pattern, built with HTML, CSS and JavaScript.
Web Design · 6 min read
Design clearer data visualizations with meaningful labels, readable comparisons, text alternatives and honest treatment of missing values.
Web Design · 7 min read
Design useful empty, error and loading states for web apps. Learn what each message should explain, which action to offer and how to review recovery.
Web Design · 17 min read
Discover 10 essential digital asset marketplace features, from smart search and licensing to creator profiles, previews and responsive design.
Next in Web Design
VesperScopeHave a website in mind?
A short outline is enough to start a conversation.
Discuss your project View my 99designs profile5.0 / 5 from 25 reviews on 99designs. Read client feedback.